
Contributors to this Article: Jacob Dittmer, Scott Swigart, Sean Campbell, Colleen Clancy and Isabel Gautschi.
Like many firms, when we first started, we relied on manual means of coding and analysis for processing our qualitative findings. It’s a time-consuming task, so we were always on the lookout for any software or tool that could speed up the process. We were lucky to find MAXQDA because it does just that.
That’s not always the case for qualitative coding software, especially when it comes to B2B.
We’ve found that many qual focused software packages are designed for an academic audience. Unfortunately, those approaches or workflows just aren’t that applicable to a B2B market research firm.
Looking to implement a standard coding and categorization tool, we investigated a number of solutions. All except MAXQDA lacked something we needed: the ability to easily edit text while coding.
While many factors influenced our decision, here are some of the reasons that MAXQDA topped our list:
- The ability to edit text as you code.
- Opportunities to extract quantitative data from qualitative research.
- Variable input.
- Exporting formats.
- A smooth overall user experience.
- The untapped, expanding feature set.
MAXQDA also allows for several key formats in exporting coded segments. Within the program, it’s simple to export coded segments to Excel or text file where they remain neatly arranged in a categorical hierarchy. You can even isolate specific segments of categories to export.
This makes it easy for us to show a client coded quotations about sales practices, product pain point, or any other area of interest.
The Excel sheet export also benefits our research by performing various types of data analysis on top of the coded segments.
Optimizing & Enhancing our Workflow
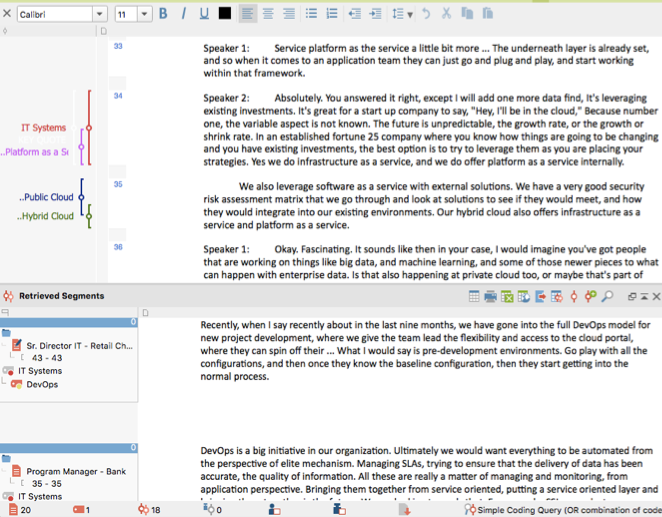
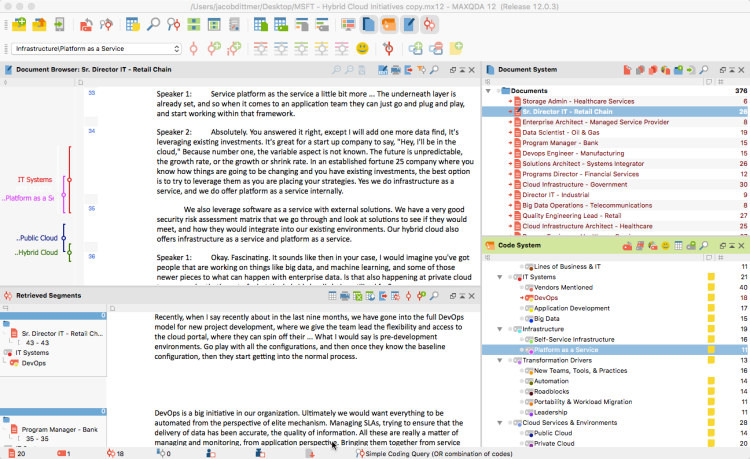
MAXQDA’s user interface shows overlapping coded segments (above), easily reviewed and sorted segments (below), and, most importantly to us, the option to edit text as you code.
As a company that specializes in working for B2B technology companies, our projects tend to involve a litany of acronyms, technical jargon, and bizarre vendor names.
As a company that specializes in working for B2B technology companies, our projects tend to involve a litany of acronyms, technical jargon, and bizarre vendor names.
Additionally, nearly all of our interviews take place via cell phone, landline, or Skype. Sometimes these calls are international, sometimes the source is out to lunch or walking through an airport, and sometimes they are driving through unreliable cell service regions. Audio quality tends to be inconsistent. As a result, checking transcripts for accuracy is a must.
We don’t really expect our transcriptionists to know the ins and outs of our research, but we also don’t want “staple sticks” (a transcriptionist’s interpretation of “table stakes”) showing up in our findings. Likewise, if we are researching virtualization technologies, we know that VMware will come up, but a recent transcription opted for “viember” as the preferred term.
Is it fair to expect these transcriptionists to know that “JSON” is all caps or how to spell properly “Node.js”? No, not really, but it is important that we catch these terms and make sure they are accurate in the analysis stage.
There is no quick fix to this aspect of our research. Unfortunately, there is still just no way around manually editing transcript text to accurately reflect the terminology.
However, we’ve found that coding with pre-defined categories or a more organic, bottoms-up approach can be tricky when trying to keep hierarchies and interrelations in mind. We’ll admit, our analysts have spent many coding sessions with a separate note pad open reminding them of the categories as they read through the transcripts.
Editing the text within the original transcript exacerbated this laborious process.
MAXQDA has made the workflow much more efficient. We are now able to code, categorize, and edit transcript errors at the same time.
Luckily, MAXQDA has made the workflow much more efficient. We are now able to code, categorize, and edit transcript errors at the same time.
MAXQDA’s software interface not only keeps categories in constant view, but it also offers a “creative coding” feature which presents the categories in a visual network map. This view allows you to scan the universe of their code set, connect related categories, and order hierarchies as you see fit.
With MAXQDA, the researcher may also apply as many code categories to sections of text as possible. You can code a whole paragraph, isolate sentences, and segments, apply differing categories, etc. We’ve found it’s particularly useful to code for a general category, then separate sub categories within the selected segment.
Additionally, coding segments as “positive” or “negative” allows you to highlight tone in interesting ways. It’s also an excellent opportunity to extract quant data from qual research. Think, “75 percent of customer feedback was positive” or similar.
Lastly, we’ve found it’s always useful to isolate “key quotes” or segments of content that stand out as exceptional encapsulations of a theme, idea, or piece of customer feedback. In our qualitative studies, there tends to be at least one game-changing statement that grabs our stakeholders’ attention.
Obviously, having the ability to create a category for those statements is immensely helpful. Even better, we can create that category with the overall details of the study still in plain view.
Once coding is completed, the analysis stage requires review of the coded content. Here, MAXQDA proves its worth again with its simplified method of retrieval and review. It’s a lot like sorting an Excel column, but much easier to read as text. You can see all codes related to a specific category on the screen at once- an obvious benefit for analysis.
Likewise, there are numerous variable input options that allow researchers to imbed documents with relevant context and demographics on each interview. Want to see what members of financial services said compared to those in utilities? Simply account for an industry/sector variable when reviewing and coding the transcripts then retrieve and sort accordingly.
Other Features
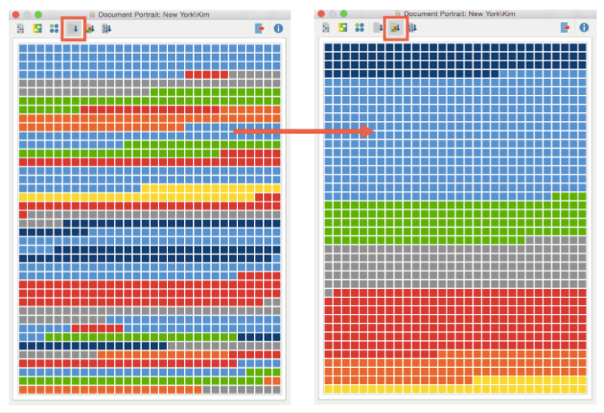
Document Portrait shows coded categories in an easily consumable visualization
We’ve been happy with our alternative tools and methods when analyzing social channels and survey responses, but MAXQDA’s excellent Twitter and survey import features are pushing us to rethink our current tool set.
The Twitter import feature draws in tweets and hashtags within specified parameters. It’s always nice to throw in a little value add data with our research and Twitter sentiment tends to be a crowd-pleaser.
For example, in some cases, customer interviews show overwhelming satisfaction with support and/or help desk. The Twitter commentary tends to make this message sink in even more viscerally.
In addition to these visual tools for review of the coding categories, MAXQDA’s feature set offers a number of visual and analytics options we have yet to realize fully in our research processes.
For example, the Code Relations view presents a visual representation of the quantity of quotes for given variables and provides the researcher a quick overview of how two variables interrelate.
We see opportunities to examine the overlapping nature of code categories in win/loss research projects for clients.
We see opportunities to examine the overlapping nature of code categories in win/loss research projects for clients.
Similarly, the Document Portrait feature presents an interview transcript in a color block view that shows the coded segments contained in the document. This view provides a quick visualization of a particular transcript and its dominant categories.
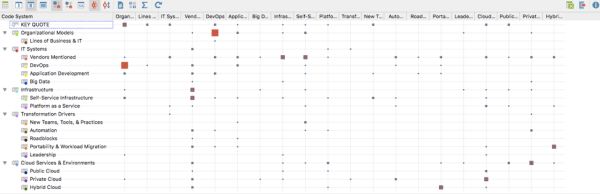
The Code Relations Browser shows the interrelation of code categories by highlighting the areas of overlap with larger blocks.
Plopping open-ended survey comments into an Excel sheet has worked well enough, but we’re enticed by MAXQDA’s ability to code these responses in a well-organized reviewing mechanism designed for that purpose. Enhanced views of the research are always valuable.
When coding within MAXQDA, memos and notes are built directly into the platform for analysts to comment and leave questions for one another within the same project file. The lead analyst can clearly define coding categories and answer questions from fellow researchers within a shared project file. This saves a lot of time when spinning up secondary analysts.
With MAXQDA, we have seen drastic improvements in the time spent coding and analyzing findings as well as a significant lift in the overall quality of our findings. Better findings lead to better analysis, which leads to more meaningful insights for stakeholders.
This article is brought to you by Cascade Insights®. We specialize in market research and competitive intelligence for B2B technology companies. Our focus allows us to deliver detailed insights that generalist firms simply can’t match.
For more examples of our views on B2B Market Research, check out our podcast for interviews with thought leaders, tips of the trade, and the key questions stakeholders want answered.