
Ageism in tech is common knowledge, but, oddly, there doesn’t seem to be a lot of data on it.
Sure, there’s Dan Lyons’ scathing “Disrupted: My Misadventure in the Start-Up Bubble” and quite a few think pieces. But where are the surveys, diversity reports with age statistics, and quantitative studies?
For all that’s been written on the subject, we were surprised to learn that many news articles and blog posts seem to cite the same handful of data sources.
We looked at some of the most frequently cited sources on ageism in tech and then went in search of more data. Once again, LinkedIn ad targeting revealed a lot. We found that in the computer games, software, and hardware industries, most employees are under age 35.
Tons of Quotes, Few Statistics
Googling “ageism in tech” turns up a flurry of articles critical of Silicon Valley’s tendency to favor the young. “Silicon Valley’s not-so-secret bias: Ageism,” “Is Ageism In Tech An Under-The-Radar Diversity Issue?”,” “It’s Tough Being Over 40 in Silicon Valley,” blare recent headlines from USA Today, Fast Company, and Bloomberg respectively. “No one in tech will admit that they’re old”, a senior editor at LinkedIn recently wrote.
Reading through the top Google news results for “ageism in tech” reveals that reporting on the subject relies heavily on the same few data sources.
Much of the data is qualitative in nature. Many news organizations leverage interviews with knowledgeable subjects such as current and former tech employees, workers who say they experienced discrimination, or industry commentators such as Dan Lyons. You’re also likely to come across quotes from tech leaders such as Mark Zuckerberg, who once famously stated that “young people are just smarter”.
The PayScale Study
PayScale, a salary profile database, released a study about ageism in tech. This is the most frequently cited quantitative study in the top news articles about ageism in tech that we came across.
The oft-cited PayScale study had damning findings. For this study, PayScale surveyed 33,500 non-retail or sales employees from “large/well-known” tech companies.
Looking at the PayScale data, we had the following observations:
- PayScale states that “the national median age for all full-time (non-retail) workers is 37.” Only HP had a higher median age at 38, and only Oracle matched at 37. The other 16 companies had a median age that was below the national average.
- Old guard tech companies have the oldest employee bases. For example, Oracle employees have a median age of 37, IBM’s median age is 36, and Microsoft’s is 33.
- Newer companies have younger median ages. For example, the median age of Facebook and LinkedIn employees is 29, and 30 for Salesforce, Google, and Amazon.
- Seven of the 18 companies in the Payscale study have a median employee age of 30 or younger.
The PayScale study has fascinating data on the median age of employees for 18 well-known tech companies.
However, many questions about ageism in tech remain. To name a few, what’s the average age for various tech job titles? What is the average age for the tech industry in general? What’s the average age in tech startups?
Though far less frequently cited in the news, we decided to check out some other quantitative data sources for more information on ageism in tech.
Government Data
EEOC
The Equal Opportunity Employment Commission (EEOC) examines legal charges, resolutions, settlements, and similar actions.
This data is useful when gathering information on how often ageism in tech is legally challenged. However, the EEOC does not tell us about the ages of tech employees by company, industry, title, etc.
BLS
The Bureau of Labor Statistics (BLS) has conducted the Current Population Survey since the 1940s. Currently, 60,000 individuals are surveyed each month. The BLS uses the survey responses to report on trends such as unemployment. They also keep track of the average age of workers by industry.
BLS data is good for an aggregate view, but it has a major limitation for those studying ageism in tech: survey respondents get to pick the industry that they work in.
This means that a computer programmer for a trucking company might select “computer systems design and related services” as their industry.
So the BLS may give an average age for a computer programmer, but you would have no idea whether they work for a tech giant, a hospital, a manufacturing company, or the government, etc.
The BLS can also give the average age of workers in an industry. What you can’t figure out from public BLS data, however, is the average age of a computer programmer in a software company, etc
Diversity Reports Are Rare, Age Data is Rarer
With public outcries against sexism and racism in tech, the release of diversity reports tends to draw media attention. However, news reports on ageism in tech rarely reference age data from company-released diversity reports.
This isn’t surprising. Not all companies release reports annually or even at all. Still fewer release statistics on their employees’ ages.
We’ll share an example from our recent study on the gender gap in tech. For this study, we looked at 50 big tech companies. Only 20 of those companies had released a diversity report with a gender breakdown since 2015.
Of those 20 diversity reports, only four also included statistics on the ages of the employees.
What LinkedIn Ad Targeting Reveals About Ageism In Tech
Though not cited in any news reports, we turned to LinkedIn ad targeting to find out more about ageism in tech. This data source had proved extremely valuable in our recent study on the gender disparity in tech. Luckily, LinkedIn ad targeting was also advantageous for researching ageism.
LinkedIn ad targeting uses the industry of the employing company to infer each user’s industry. This means that if you chose to target a LinkedIn ad at people in the computer software industry, your audience would be employees who work for computer software companies. (In other words, this data gets around the limitation of the BLS data.)
Compellingly, as we analyzed the ages of employees across several industries, we were able to examine a sample of more than 74 million people. (See the appendix at the end for details on how we found our data.)
When studying ageism, LinkedIn offers a clearer view of the tech industry than BLS data, and a much larger sample than PayScale provides.
Our Study
With LinkedIn ad targeting, we built a sample that comprised 74,200,000 individuals from all over the world across 17 industries. Our sample includes several tech industries like computer gaming, computer software, and computer hardware. Tech industry workers made up an estimated 13,860,000 of the profiles in our sample, from small businesses to corporate giants. For comparative purposes, we also looked at industries such as management consulting, defense and space, and pharmaceuticals.
As we examined this sample, ageism was obvious in the numbers. Here are a few of our findings.
Most Employees Are Under 35 In These Industries
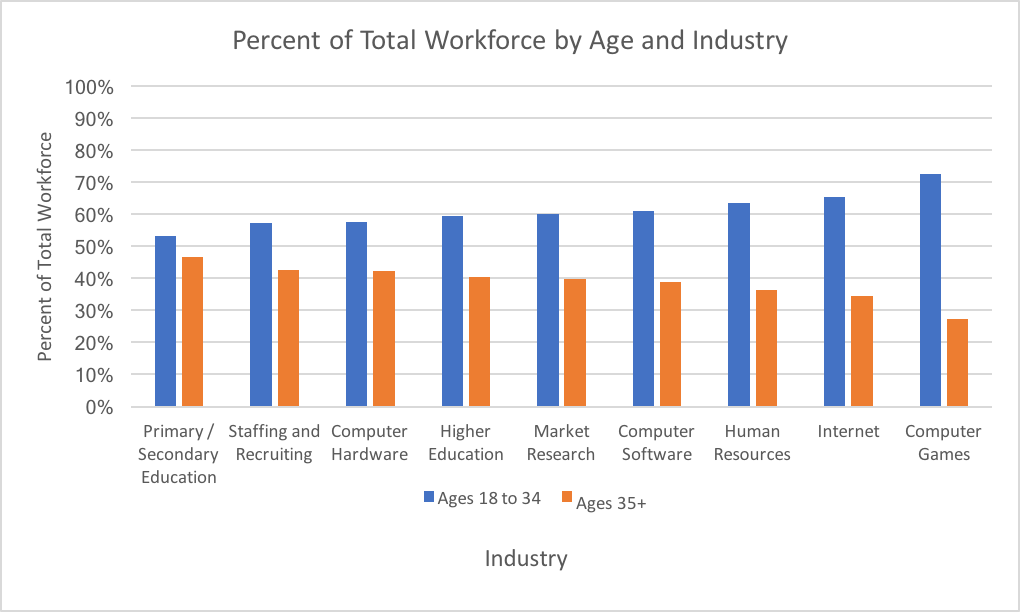
- For every employee age 35 or older, there are about two employees under 35 in the Internet industry.
- In computer gaming, there are more than two times as many 18-34-year-old employees as there are employees age 35 or older.
Other Industries Are Kinder To Those Over 35
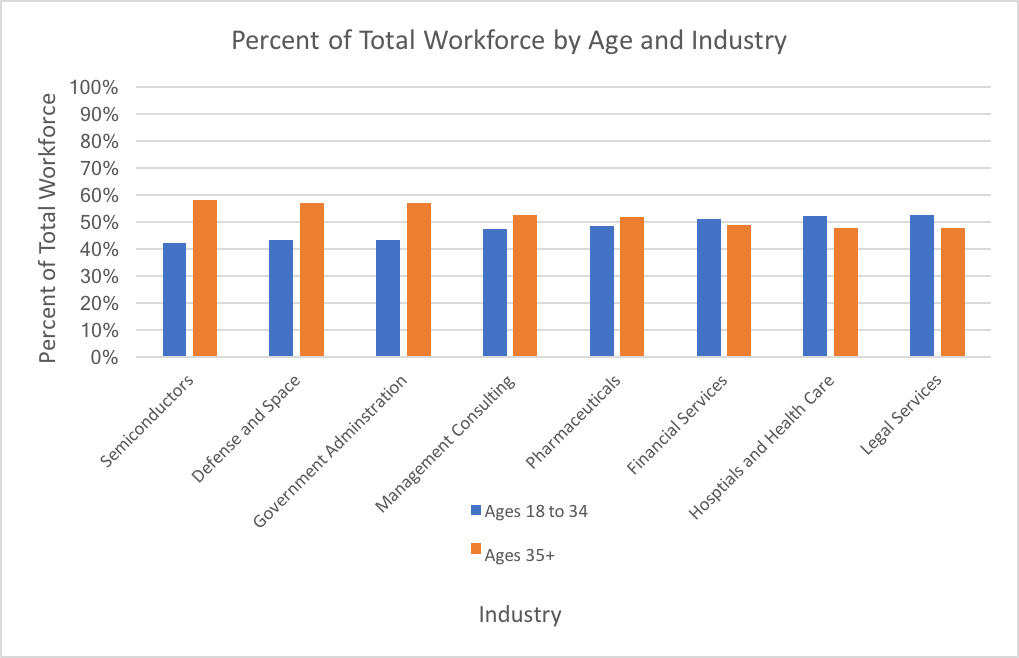
- There were more 35+ year-olds than 18-34-year-olds in only five of the 17 industries in our study. (Semiconductors, defense and space, government administration, management consulting, and pharmaceuticals.)
Workers 55+ Were a Minority in All 17 Industries In Our Study
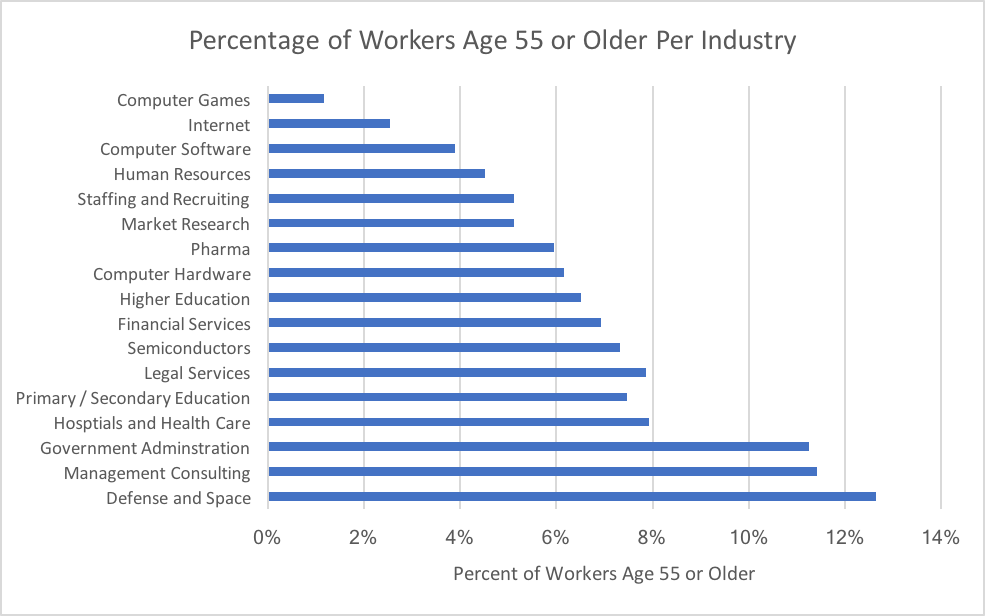
- Of the industries we looked at, defense and space had the highest percentage of people over the age of 55 (approximately 13 percent), followed by management consulting (roughly 11 percent), and government administration (about 11 percent).
- Only about 1 percent of computer gaming employees are 55 or older.
How LinkedIn Gets Its Data
For ad targeting, LinkedIn infers the age of the user from their last graduation year.
Our total sample size for this study was 74,200,000 profiles. LinkedIn was able to determine age for 33,390,000 profiles across all the industries in our study. It was unable to determine the age for 40,810,000 profiles.
Does LinkedIn Provide a Representative Sample for Tech?
Comparisons Are Tricky
In the absence of company-released age data and quantitative studies on age in tech industries, there isn’t much to compare our data to. This is unfortunate as it makes it difficult to test the validity of results.
The PayScale study examines age in certain tech companies. Since our study focuses on age by tech industry, it doesn’t make sense to compare the two data sets.
Similarly, BLS data takes into account the industry of the job but not the employing company. Looking at BLS data for computer software professionals doesn’t guarantee that we are looking at people from the computer software industry. Again, it isn’t an appropriate comparison.
The Scope of the Data is Compelling
Still, LinkedIn provides valuable information on ageism in tech.
From a market research standpoint, LinkedIn’s sample size (in the millions!) is incredibly worthwhile. In this study, we had a sample size of more than 74 million profiles. LinkedIn could determine the age for 45 percent of those profiles. In comparison to typical market research survey response rates, this is a huge success.
Business analysts, researchers, and journalists should not overlook LinkedIn as a useful source of data.
However, there are a few caveats to keep in mind about using LinkedIn ad targeting data.
Some Limitations of LinkedIn Ad Targeting Data:
- LinkedIn rounds the estimated ad audience to the nearest thousand. These are approximations, not precise employee counts. For this study, the estimates did not meaningfully impact our results as the age buckets (18 to 24, 25 to 34, etc.) in our study represented an average of 490,000 profiles each. With such a large sample size, we considered LinkedIn’s ad targeting estimates to be worthwhile information.
- The age buckets LinkedIn provides are fixed: 18- 24, 25-34, 35-54, and 55+. This makes certain comparisons difficult, such as the representation of employees in the first 15 years or their careers versus those in the latter 15 years of their careers.
- Obviously, LinkedIn can only generate estimates from employees with LinkedIn profiles. If employees are unlikely to have a LinkedIn profile in certain industries, results may be skewed. Tech employees famously heavily utilize LinkedIn, but other industries may do so less.
- Although LinkedIn data provides an incredibly wide sample for ageism research, it doesn’t explain why the numbers are the way they are. To find such answers, qualitative research would come in handy.
LinkedIn Is Actually a Huge Public Data Source If You Know Where to Look.
LinkedIn is essentially a massive source of public big data. To access it, you just have to get the hang of ad targeting. You don’t have to actually publish or pay for an ad to see all kinds of demographics info from age, to gender, to job title, company name and size, degrees, and more. Data like this could form the basis of any number of fascinating quant studies.
With a sample size of millions, LinkedIn ad targeting provides an opportunity to examine ageism in tech in several different ways. Writers and researchers interested in examining ageism in tech, take note.
This study was just a cursory glance at age distribution by industry via LinkedIn ad targeting. For tech fields, the numbers revealed a drastic shortage of employees aged 55 and older. The 18-34-year-olds were the majority in most of the tech industries we looked at (and several other industries too). Maybe it wasn’t all in Dan Lyons’ head.
Appendix: How To Find Ageism Data Via LinkedIn Ad Targeting
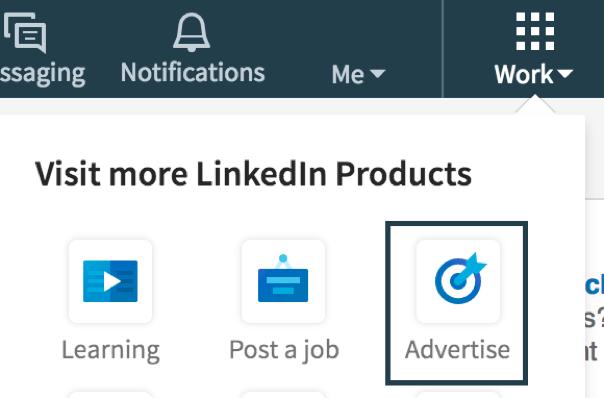
Finding a sample through LinkedIn ad targeting is easier than it sounds. Signing up for LinkedIn’s ad creator program is free and takes just a few minutes. To start, choose the work option from the top right-hand corner of the site LinkedIn and go to “Advertise.”
If you don’t have an account with their advertising program, the website will guide you through account creation.
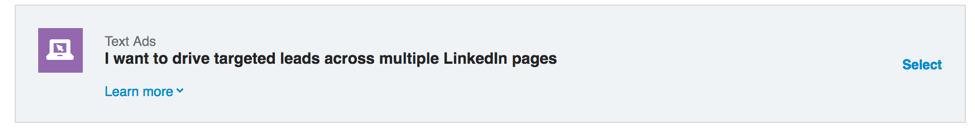
Once you are set up, you’ll create a text ad campaign. By using text ads, you don’t need a professional business page or any premade ads to see the targeting information.
While creating your text campaign, it doesn’t actually matter what it says – no one will see it. Just fill in the website, title, and description in order to move forward with the ad creation. Once you draft the ad, you’ll be able to access the targeting page.
Although LinkedIn says that location is required, you only need to enter one initially. For example, we’ve entered the United States as a location, but as soon as we add another qualifier, we will be able to click the X and remove the location for worldwide results.
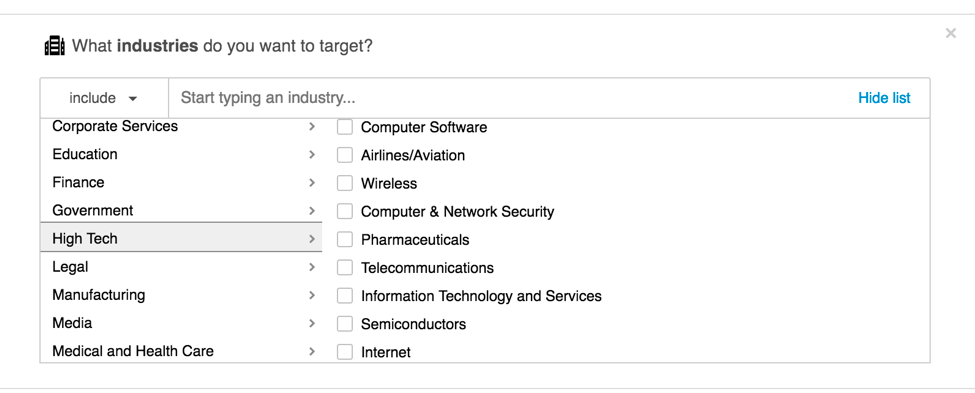
Finally, you can select your target markets to study. LinkedIn offers lists of the industries it categorizes companies by, but you can also type an industry in if you already have one in mind. With LinkedIn’s many categories to choose from, opportunities abound for studies.
LinkedIn will tell you approximately how many people are in the target audience for the ad. 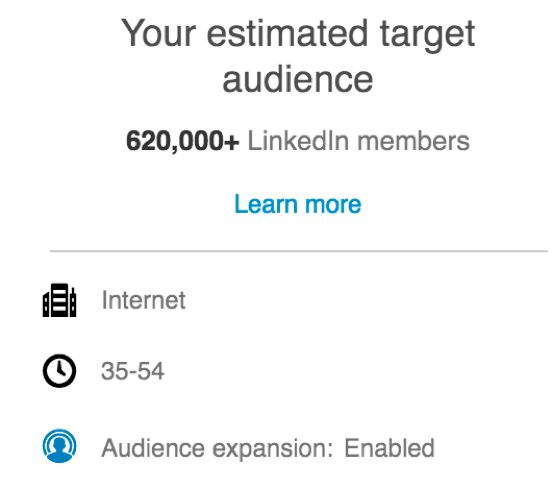
For example, when we select “Internet,” LinkedIn shows that there are roughly 4,800,000 people in this industry. When we narrow it down to see how many people ages 35-54 are in the Internet industry, LinkedIn shows an estimated 620,000.
If an audience is estimated to be less than a thousand, LinkedIn informs you that your target audience is “too narrow.”
This study was brought to you by Cascade Insights®. We specialize in market research and marketing for the B2B tech sector.